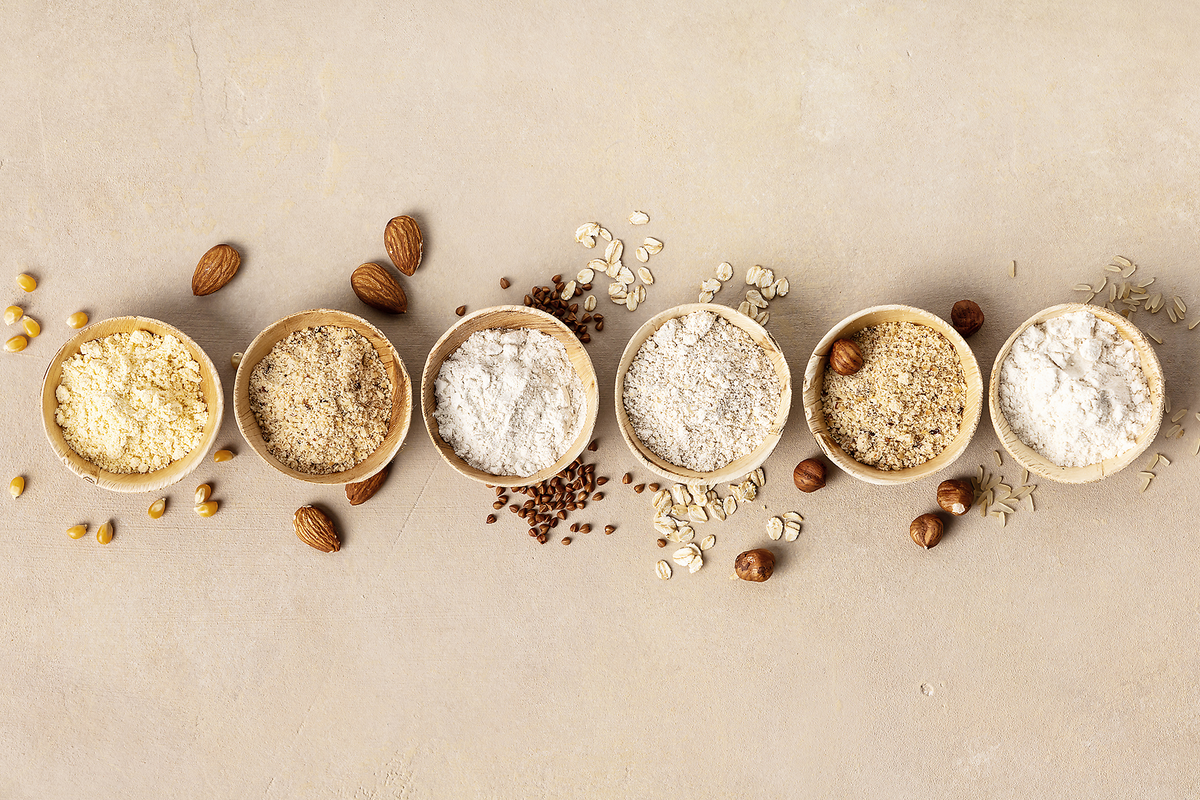
Flour and seeds
- Batch-to-batch consistency
- Supporting research for improved seed varieties (such as higher protein content, better nutritional properties)
- Determination of protein content for nutritional labeling and quality control
Yoghurt, cereal, bread, meat - the variety of food is enormous and its composition changes depending on production, origin or processing. Awareness of good quality food and healthy components has grown over the past years, pushing the industry towards faster but at the same time more accurate analysis methods and more parameters.
Quality controls for product safety and standard compliance are regular procedures in the food industry, using different parameters to determine quality and consistency for the customer. Due to the varying nature of the samples tested and flexibility in the analysis procedure it is important to maintain reproducibility. Samples range from liquids to solids such as seeds to paste-like materials like minced meat, requiring adaptable systems and also overlapping parameters that can be compared and used for several types of food.
Carbon is the main structural element of all organic compounds: carbohydrates, fats, proteins or organic acids. The amount of total carbon (TC) is therefore a direct indicator of the total organic content in a food sample.
This can be used to set a nutritional value for the end customer, the documentation of batch-to-batch consistency or detect formulation deviations. For example, stable carbon values in flour or starch products indicate consistent carbohydrate composition, which in turn stands for consistent quality. In processed foods, changes in total carbon content may reflect variations in composition, such as moisture loss or formulation differences. In certain applications, carbon analysis can support process monitoring, for example in roasted cereal products, coffee, or baked goods.
Protein contains about 16 % nitrogen in the form of amino acids. The amount of nitrogen is therefore directly in relation to the protein content of a food sample. By measuring nitrogen content and applying established conversion factors (e.g. 6.25 for many foods), the protein content of tested food samples can be determined. In many food markets, protein content must be declared on product labels, as it is a key indicator of nutritional quality and significantly influences the market value of protein-rich foods.
Nitrogen analysis supports the control of incoming unprocessed materials and therefore the qualifications of suppliers. Similar for carbon, nitrogen content is also a parameter for batch-to-batch consistency. For example, protein defines the baking quality of wheat and flour products and dough elasticity in baked goods, making it a critical part of product quality management. Similarly, this is the case in the milk and animal feed industry, where protein content defines product grade, formulation, and pricing.
| Foods | Factor | ||||
| Milk | 6.38 | ||||
| Barley, oats, rye | 5.83 | ||||
| Rice | 5.95 | ||||
| Wheat flour | 5.70 | ||||
| Soybean | 5.71 | ||||
| Nut, seeds | 5.30 | ||||
- Batch-to-batch consistency
- Supporting research for improved seed varieties (such as higher protein content, better nutritional properties)
- Determination of protein content for nutritional labeling and quality control
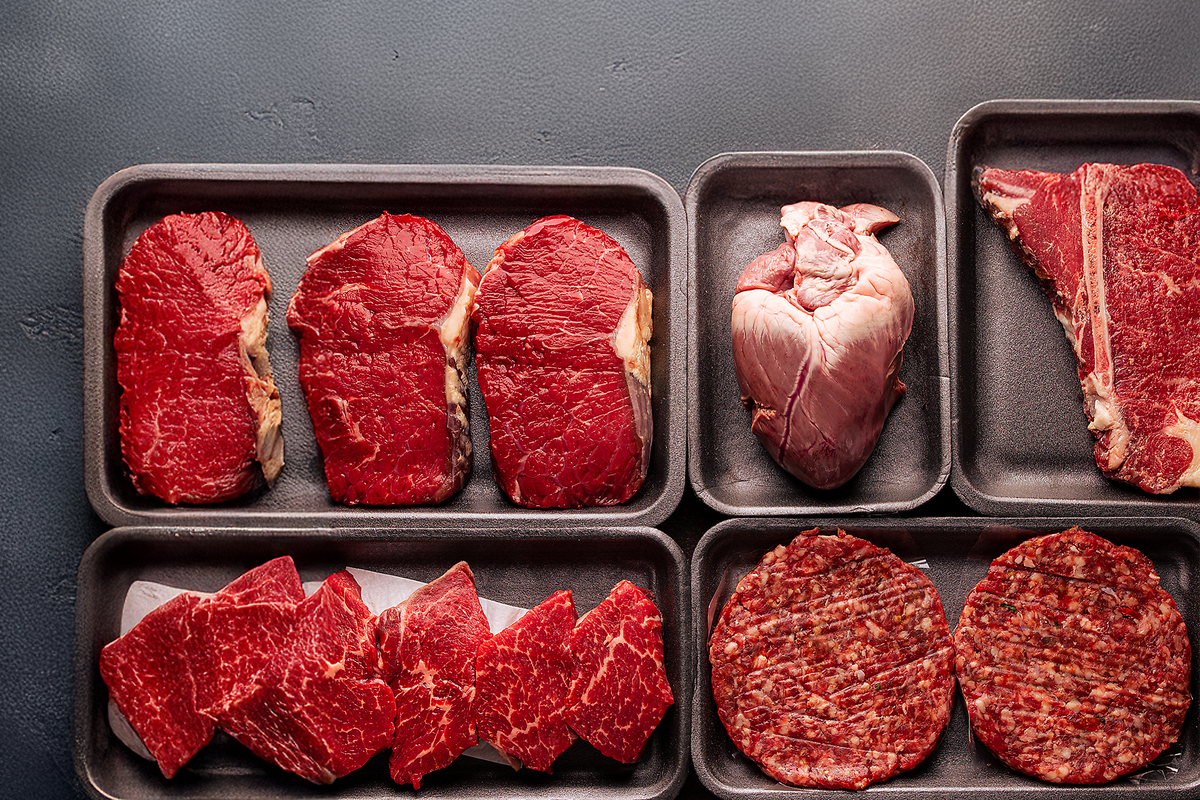
- Verification of meat authenticity and prevention of food fraud
- Monitoring levels of protein in processed meat products
- Determination of protein content for nutritional labeling and quality control
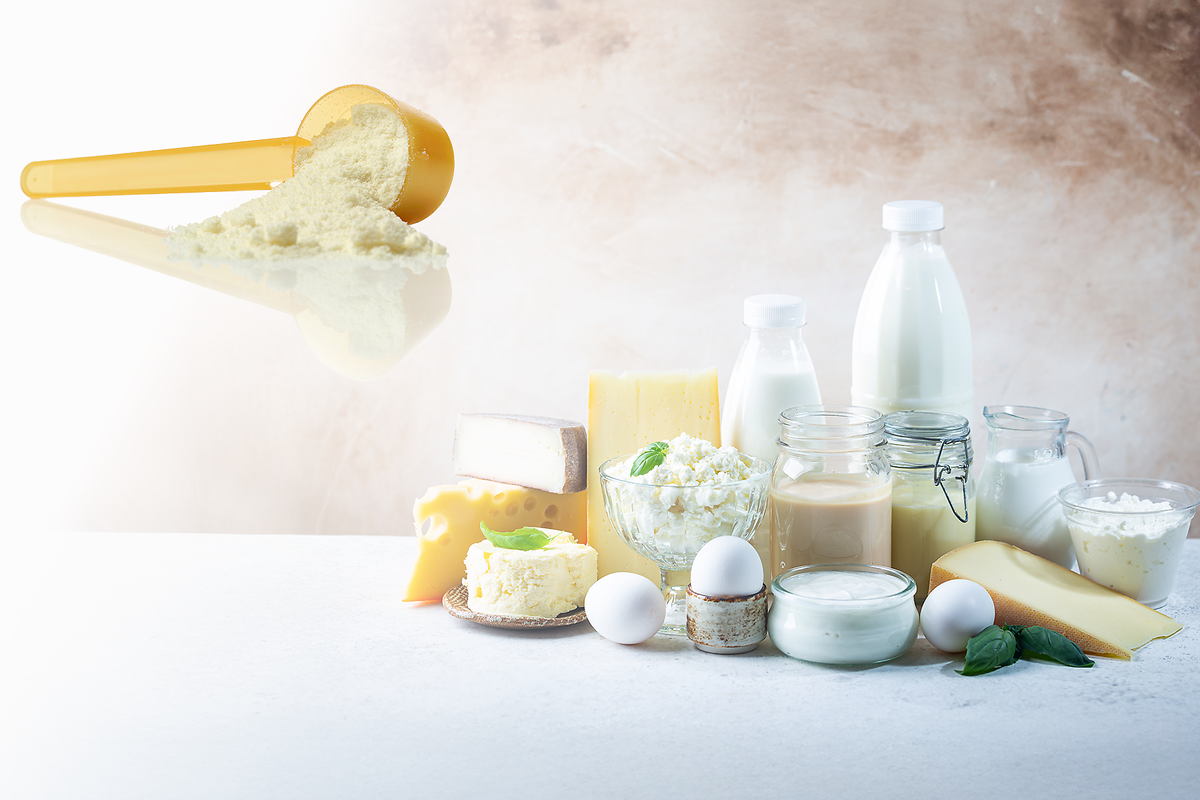
- Analysis of solid or liquid samples such as cheese, blue cheese, yogurt and milk
- Determination of protein content for nutritional labeling and quality control
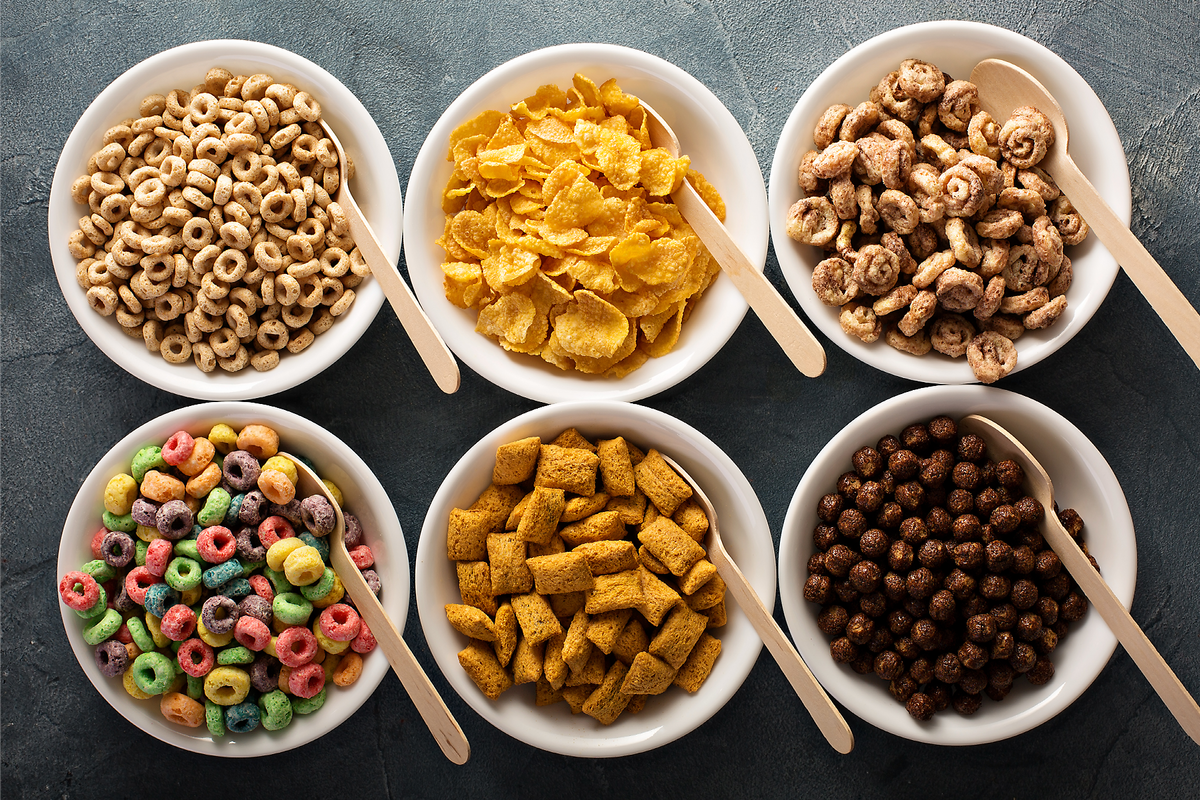
- Quality control regarding overprocessing or roasting effects
- Determination of protein content for nutritional labeling and quality control
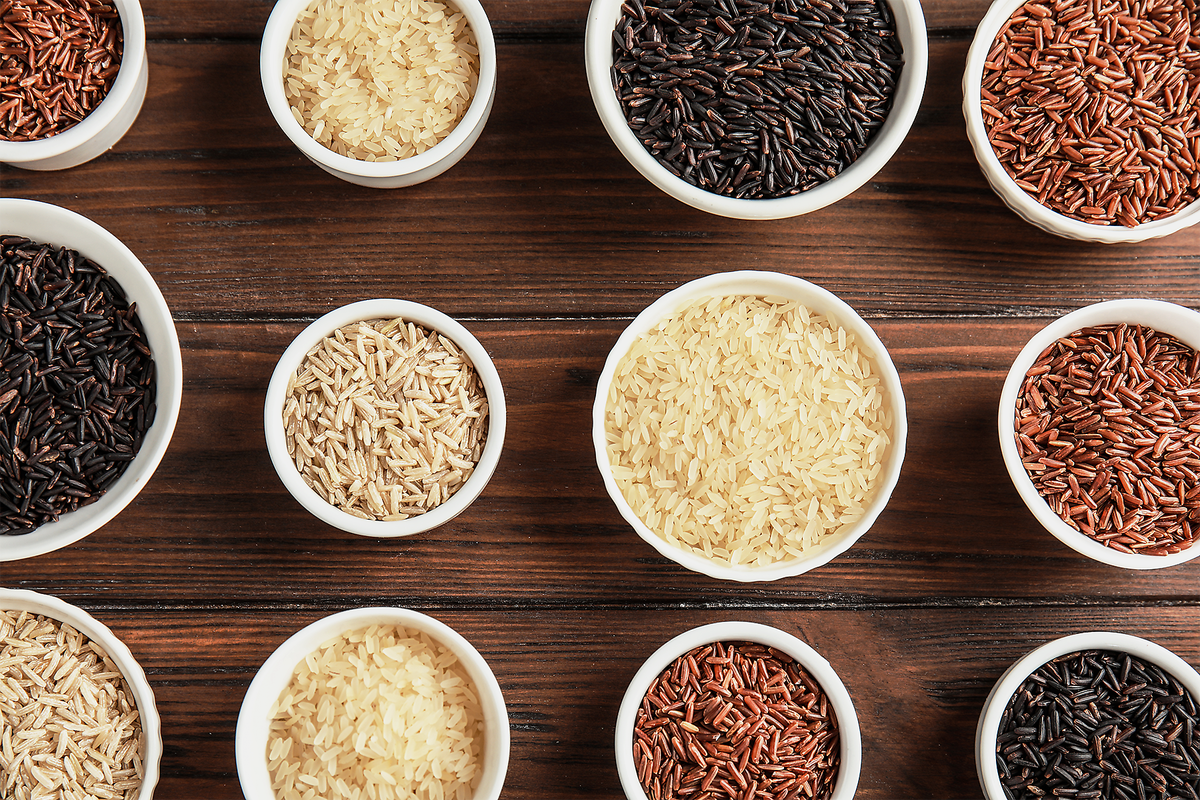
- Supporting research for improved rice varieties (such as higher protein content, better nutritional properties)
- Determination of protein content for nutritional labeling and quality control
The Dumas combustion method has become a reliable reference method for analyzing nitrogen and carbon in foods, especially as labs seek safer and faster workflows. Many standards include the Dumas alongside the Kjeldahl method (e.g. ISO 16634 for cereals, AOAC 992.15 for meat products). Both Dumas and Kjeldahl determine total nitrogen, which is converted to protein by a factor (e.g. 6.38 for dairy, 6.25 for most foods). The Dumas method combusts the entire sample at high temperature, converting all nitrogen compounds into measurable N2 gas.
The Dumas method provides results in minutes versus hours or more for Kjeldahl, making Dumas particularly attractive for high-throughput food industries. The ELEMENTRAC CN-r analyzer delivers rapid nitrogen/protein and carbon results, with an analysis time of 2 minutes and 30 seconds per sample. This enables high throughput testing of food products: a single instrument can run hundreds of samples per day, which is ideal for QA/QC laboratories in sectors like dairy (e.g. milk powder, whey products), meat processing, or grain milling.
Fast analysis doesn’t compromise accuracy: the ELEMENTRAC CN-r uses pure oxygen combustion followed by sensitive thermal conductivity detection for nitrogen and infrared detectors for carbon determination to ensure reliable measurements.
| Measurement range | Nitrogen: 0.03 – 300 mg Carbon: 0.02 – 175 mg |
||||
| Typical weights | Up to 1.0 g, 0.5 g nominal | ||||
Our Dumas analyzer is fully automated – an operator simply weighs the sample into a tin foil or tin capsule, places it in an autosampler, and the analyzer does the rest. The ELEMENTRAC CN-r is built for continuous high-throughput operation: featuring a maintenance mode that allows rapid replacement of consumables and reagents in about 15 minutes – all while the analyzer remains in a ready state.
Consumable costs per test are low using the ELEMENTRAC CN-r and mostly limited to inexpensive and non-hazardous reagents like absorbents, catalysts and gases. The efficient design like a chromium-free catalyst and easy to handle combustion tube also extends consumable life – contributing to a lower cost of ownership over time.
The ELEMENTRAC CN-r operates with non-hazardous consumables (e.g. copper, CO₂/H₂O absorbents) and generates only small amounts of waste, making it safer for lab personnel and more environmentally friendly.
In today’s food industry labs, the Dumas combustion method has become a preferred solution for protein (nitrogen) and carbon analysis, offering major advantages in speed, safety, and throughput. Academic and regulatory acceptance of Dumas is now well-established - for example, ISO and AOAC standards for many foods include the Dumas method. Our analyzer is compliant with the common standards for food analysis using the Dumas method:
| Sample | Standarts | ||||||||
| Oilseeds, cereals & grain | • AACC 46-30 • AOAC 992.23 • AOCS Ba 4e-93 • DIN EN ISO 16634-1, DIN EN ISO 16634-2 • GAFTA Method 4:2 • ICC Standard No. 167 |
||||||||
| Food | • AOCS Ba 4f-00 • ISO 16634-1, ISO TS 16634-2 • §64 LFGB methods 17.00-18, 18.00-18, 22.00.2, 48.01-26 |
||||||||
| Meat | • AOAC 992.15 • OIV-MA-AS323-02A • § 64 LFGB 06.00-20 |
||||||||
| Milk & dairy products | • AOAC 992.15 • ISO 14891 / IDF 185 • § 64 LFGB methods 01.00.60, 02.00.24, 03.00.27, 48.01-26 |
||||||||
| Animal feed | • AOAC 976.05, AOAC 968.06, AOAC 990.02, AOAC 990.03 • AACC 46-30 • DIN EN ISO 16634-1 • GAFTA Method 4:2 |
||||||||
| Beer | • AOAC 920.53, AOAC 950.09, AOAC 997.09 • MEBAK 2.6.1.2 |
||||||||
| Wine | • OIV-MA-AS323-02A | ||||||||
Using the Dumas combustion method, the ELEMENTRAC CN-r determines nitrogen/protein and carbon reliably and with high precision. Standard deviation is norm compliant with the commonly used food applications, guaranteeing consistent results.
| WHEAT | WEIGHT [mg] |
NITROGEN [%] [mg] |
PROTEIN [%] | ||||
| 400.69 | 1.69 | 9.65 | |||||
| 400.28 | 1.70 | 9.67 | |||||
| 400.87 | 1.72 | 9.78 | |||||
| 400.04 | 1.72 | 9.80 | |||||
| 400.29 | 1.67 | 9.50 | |||||
| 400.54 | 1.69 | 9.65 | |||||
| 400.42 | 1.70 | 9.67 | |||||
| 400.82 | 1.70 | 9.69 | |||||
| 400.76 | 1.73 | 9.86 | |||||
| 400.64 | 1.70 | 9.68 | |||||
| Mean value | 1.70 | 9.70 | |||||
| Deviation [%] | 0.017 | 0.098 | |||||
| Relative Deviation [%] | 1.012 | 1.012 | |||||
Figure 1: Nitrogen levels and peaks obtained using the ELEMTRAC CN-r for grinded wheat samples. Protein factor of 5.7 was used.
| MINCED MEAT | WEIGHT [mg] |
NITROGEN [%] [mg] |
PROTEIN [%] | ||||
| 362.42 | 3.60 | 22.48 | |||||
| 381.03 | 3.55 | 22.21 | |||||
| 346.53 | 3.66 | 22.89 | |||||
| 374.59 | 3.59 | 22.46 | |||||
| 340.80 | 3.56 | 22.26 | |||||
| 362.60 | 3.56 | 22.28 | |||||
| 350.58 | 3.57 | 22.28 | |||||
| 343.73 | 3.57 | 22.30 | |||||
| 381.51 | 3.60 | 22.52 | |||||
| 350.21 | 3.60 | 22.50 | |||||
| Mean value | 3.587 | 22.418 | |||||
| Deviation [%] | 0.032 | 0.202 | |||||
| Relative Deviation [%] | 0.902 | 0.902 | |||||
Figure 2: Nitrogen levels and peaks obtained using the ELEMTRAC CN-r for minced meat samples. Protein factor of 6.25 was used.